- Why Bother Using D3 Scales? Couldn’t We Plot It Directly?
- What are Input Domain and Output Range?
- How do the input domain and output range work?
- D3 Scales Do Not Capture Relative Length
- How does d3.scaleLinear() work?
- What Does d3.scaleLinear() Preserve?
- How to Maintain Relative Length?
- Closing Words
- Other resourses
Most online tutorials on D3 scales, at best do not get the point, and at worst are really misleading.
Before I move on, I’d like to specify two most important points I realized about D3 continuous scales:
The essence of D3 continuous scales is interpolation between two known points;
D3 continuous scales are supposed to capture relative positions, not relative length.
This blog post is all about D3 continuous scales. I might omit the word “continuous” in the following.
Why Bother Using D3 Scales? Couldn’t We Plot It Directly?
Well, the thing is, sometimes the numbers are so big that you don’t have enough pixels to plot them directly.
For example, suppose we have this dataset, [34, 59, 109, 544, 1299], and we are going to plot a bar chart of this data. It would be best if we can draw it directly. Five bars whose heights (in pixels) are equal to the corresponding data values: The first bar will be 34 px tall, the second 59 px … and the last 1299 px. For this dataset, it might be Okay to plot it this way. However, if we had another number, 999999, it would be impossible to draw a bar whose height is 999999 px simply because we don’t have such a big screen. That’s why we need input domain and output range, both of which are basically intervals.
What are Input Domain and Output Range?
The input domain can be anything, as long as the minimum and the maximum number in our dataset are included in this interval1. Note that the start of the input domain does not have to be \(0\). For the above dataset, let’s set the input domain to be [30, 1300].
Then what is an output range? Well, it can be anything too. Usually the output range is defined by the pixels we have. Let’s say our screen is only 80 pixels in height, and we set the output range to be [10, 75]. Again, the starting point of the output range does not have to be \(0\).
How do the input domain and output range work?
What we are certain now is that the minimum (the starting point) in the input domain should also be the minimum (the starting point) of the output range. The same is for the maximum (the finishing point).
That is to say, \(30\) in the input domain becomes \(10\) in the output range, and \(1300\) in the input domain becomes \(75\) in the output range.
The situation here is depicted in the figure below:
The situation: from input domain to output range
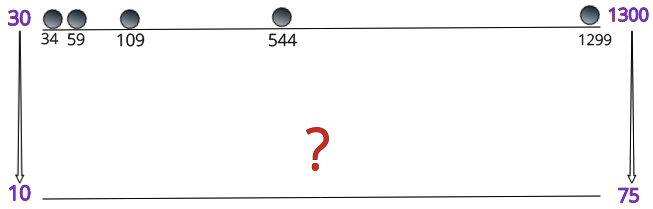
The question is, what are the corresponding values of \(34\), \(59\), \(109\), and \(544\)?
We can solve this problem by drawing a coordinate, with the X-axis representing the input domain and the Y-axis representing the output range. Why? Because as we can see from the transformations from input domain to output range, the relationship can be expressed as
\[y = function (x)\]
where \(y\) is values in the output range and \(x\) represent values in the input domain.
x<-30:1300
m0 <- 65 / (1300^0.5 - 30^0.5)
b0 <- 10 - m0*(30^0.5)
fun0 <- function(x) m0*x^0.5 + b0
m1 <- 65 / 1270
b1 <- 10 - m1*30
fun1 <- function(x) m1*x + b1
m2 <- 65 / (1300^2 - 30^2)
b2 <- 10 - m2*(30^2)
fun2 <- function(x) m2*x^2 + b2
m3 <- 65 / (1300^3 - 30^3)
b3 <- 10 - m3*(30^3)
fun3 <- function(x) m3*x^3 + b3
m4 <- 65 / (1300^4 - 30^4)
b4 <- 10 - m4*(30^4)
fun4 <- function(x) m4*x^4 + b4
matplot(x,cbind(fun0(x), fun1(x),fun2(x),fun3(x),fun4(x)),
        type="l" ,col=c("blue","red"),
        xlab = "Input domain", ylab = "Output range",
        main = "Mapping from input domain to output range")
points(30, 10, col="orange", pch=19, cex=1.5)
points(1300, 75, col="skyblue", pch=19, cex=1.5)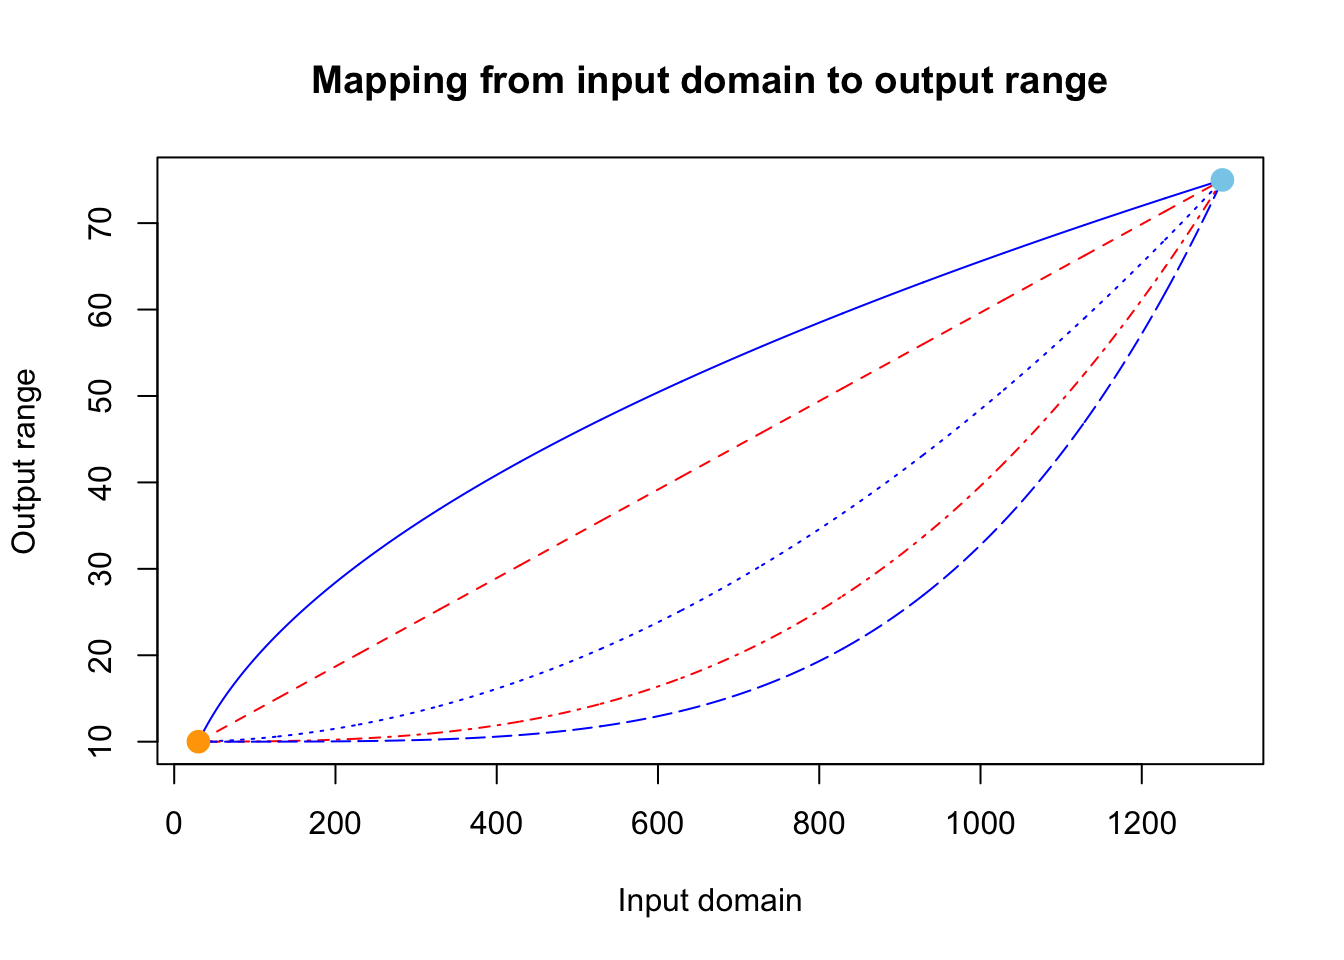
Figure 1: Mapping from input domain to output range
The two points we are certain are the orange one, which is [30, 10], and the blue one, which is [1300, 75]. Then the “mapping” is essentially we trying to interpolate from the orange point to the blue point. As we can see from Figure 1 that there are so many different ways to interpolate between the two points.
In our situation, we should use the linear interpolation. Why? Sorry that I cannot explain mathematically here. I can only explain intuitively. In our example above, there is a “shrinkage” from the input domain to the output range. However, this transformation is linear. A linear transformation can be expressed as
\[y = mx + b\]
Simple math will let us know that for out example here, \(m = 0.051, b = 8.465\).
D3 Scales Do Not Capture Relative Length
Okay. Let’s plot the bars now.
par(mfrow=c(1,2))
input.domain <- c (34, 59, 109, 544, 1299)
output.range <- fun1(input.domain)
barplot(input.domain, ylim = c(0, 1400),
        col = "orange",
        main = "Bar heights in input domain")
barplot(output.range, ylim = c(0, 80),
        col = "skyblue",
        main = "Bar heights in output range")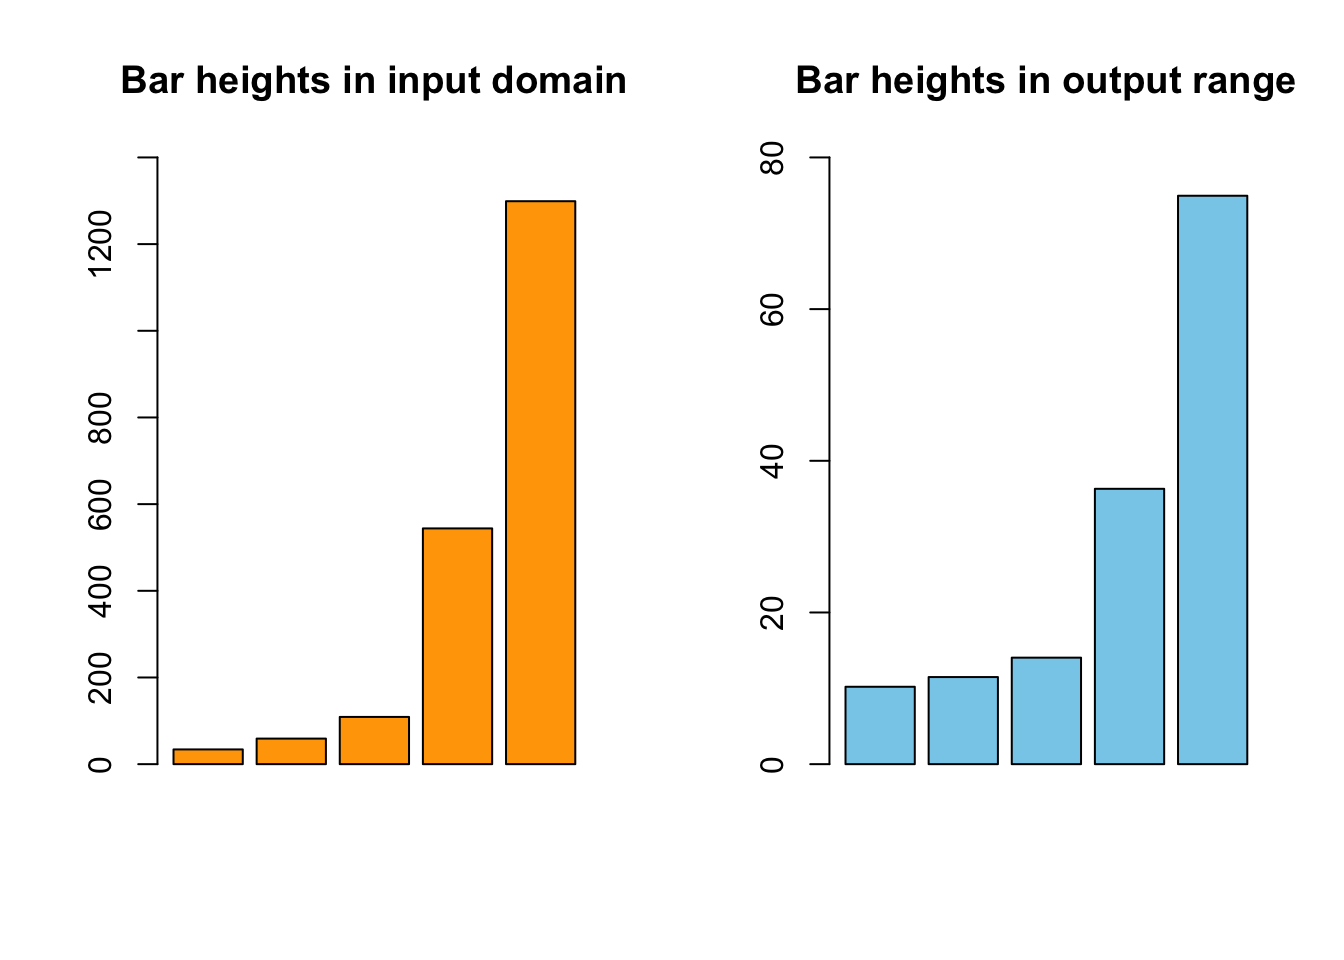
Figure 2: D3 scales do not cpature relative length
The first impression would be that it’s relatively Okay, since the two seem to be comparable. However, if you look closer, you’ll find that on the original scale, the input domain, the third bar is around 3 times taller than the first bar. However, on the transformed scale, the output range, the third bar is less than twice as tall as the first one. The relative height is not maintained, and therefore, the two results are not comparable.
“D3 scales suck”, you might say. “What was Mike Bostock thinking? D3 scales did not preserve comparability between the two results and they are misleading!”.
Well, it’s actually our fault rather than D3 scales’. Before I explain how come that the two results are not comparable and how to avoid that, let me talk about how D3’s scaleLinear() works.
How does d3.scaleLinear() work?
This tutorial very well explains how d3.scaleLinear() works. I’ll recap it here.
Suppose the following is the input domain. The starting point is labeled as S and the end E. There are three data points, i.e., A, B, C. The distance between S and A is a, that between A and B is b, that between B and C is c, and that between C and E is d. Then, how will d3.scaleLinear() compute the corresponding value for data point A, B and C in the output range?
Some data points
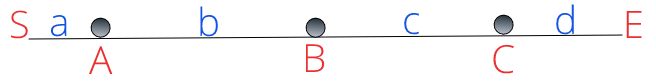
Let’s say Data point A will become Data point \(A'\) in the output range. d3.scaleLinear() will get the value of \(A'\) this way: First, it computes the proportion of the distance between A and the starting point, to the length, or range, of the entire input domain. This proportion will be \(\frac{a}{a+b+c+d}\). Let’s denote the starting point in the output range as S’, and the length of the output range as \(L'\), then \(A'\) is \(L' * \frac{a}{a+b+c+d}\) away from S`.
What Does d3.scaleLinear() Preserve?
Now that we know how d3.scaleLinear() transforms data from the input domain to the output range, let’s think about what does this transformation preserve.
Let’s normalize both the input domain and the output range. That is, we imagine that the length of the input domain and the output range is both \(1\) unit. Then, let’s divide both intervals into 100 parts. If point \(A\) in input domain sits right on the dividing line of the 2nd and the 3rd part, then, in the output range, \(A'\) will also sit on the dividing line of the 2nd and the 3rd part. Right? (If you do not understand why, please refer to /#how-does-d3.scalelinear-work) That’s why we say that D3 scales preserves relative positions of data points.
This property will be super useful in coordinates, for example, when we are plotting scatter plots.
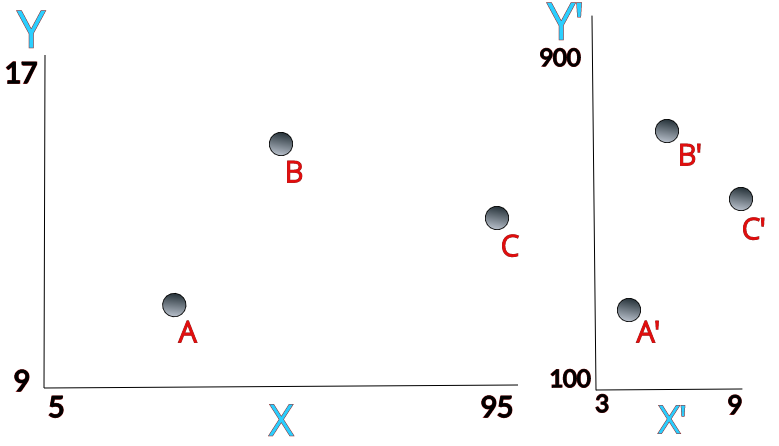
For example, we have \(A\), \(B\), and \(C\). The left is the three dots plotted using their original data values in the input domain, and on the right is the corresponding three dots plotted using the linearly transformed data values in the output range. The input domain is [5,95] for the X-axis, and [9, 17] for the Y-axis, and the output range is [3,9] for the X-axis, and [100, 900] for the Y-axis.
Let’s say the coordinate of \(A\) is \((35, 11)\) and that of \(B\) is \((50, 15)\). If we understand how linear transformation is done by d3.scaleLinear(), we’ll know that the coordinate of \(A'\) is \((5, 300)\) and that of \(B'\) is \((6, 700)\).
We can see that d3.scaleLinear() does not preserve relative length. \(\frac{x_a}{x_b} = \frac{7}{10}\), but \(\frac{x_(a')}{x_(b')} = \frac{5}{6}\). Then, what does d3.scaleLinear() preserve? Relative positions, as we discussed above.
How is relative positions maintained here?
In the input domain:
\[x_a = \frac{1}{3} X, y_a = \frac{1}{4} Y\]
In the output range:
\[x_(a') = \frac{1}{3} X', y_(a') = \frac{1}{4} Y'\]
I won’t list these for \(B, B', C, C'\) here.
You see, for each data point, the relative coordinate values change but its relative position to both axes remains the same.
How to Maintain Relative Length?
Now, let’s go back to our initial problem: the relative length is not preserved after transforming bar heights from the input domain to the output range.
I asked this question in d3js’s Slack group.
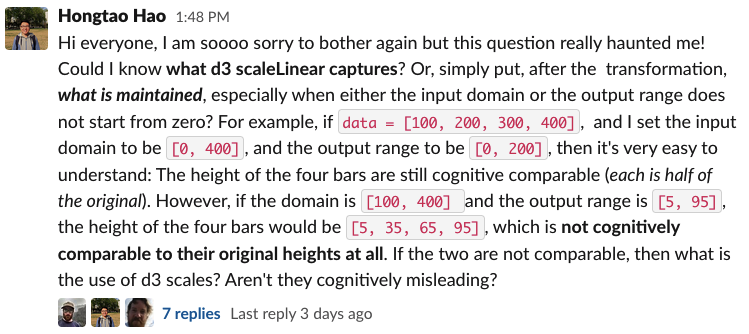
Then, Daniel Nass answered this question. Mike Bostock, the creator of D3.js also responded!
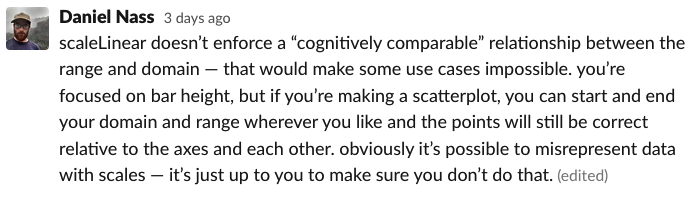
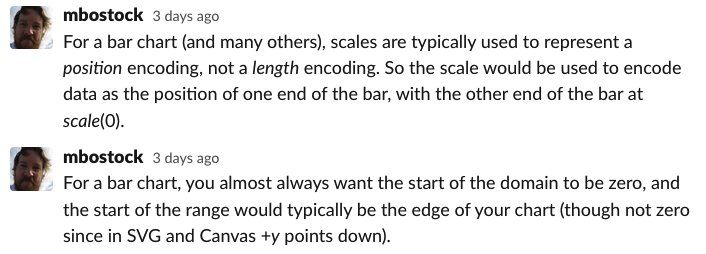
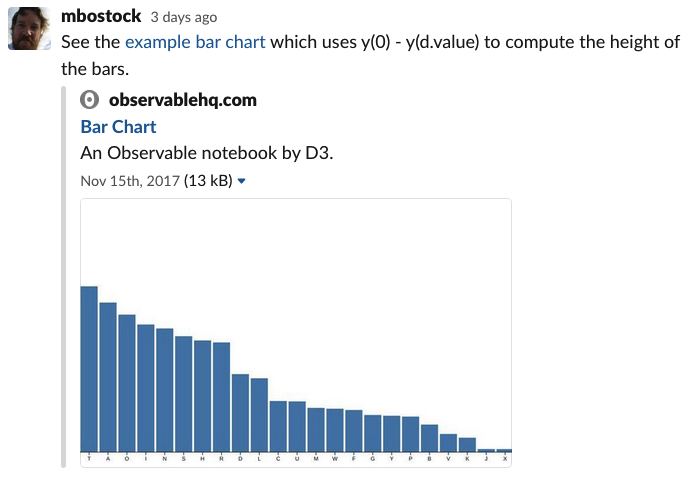
Here is the Observable Notebook Mike Bostock was referring to.
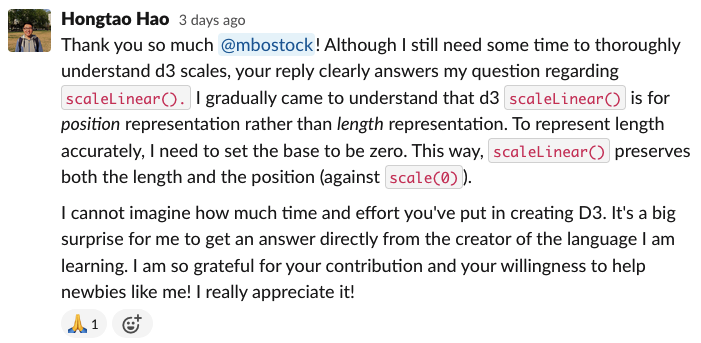
Later, I recapped my understanding and expressed my gratitude.
Closing Words
D3 scales are meant to preserve data’s relative positions to axes and each other (using Daniel Nass’s words), not their relative length. To preserve relative length, we need to set the start of the input domain to be zero, and the start of the output range to be the edge of our chart, as Mike Bostock suggested.
Other resourses
I found these articles on D3 scales helped me a lot, in order of helpfulness:
- Chapter 7. Scales of Interactive Data Visualization for the Web, 2nd Ed. by Scott Murray
- Jerome Cukier’s great page on ‘d3:scales and color’;
- Using scales by Jonathan Soma
- D3.js Scales on Dashing D3.js
- d3-scale official documentation on GitHub
Well, the min and max in our dataset do not have to be within the input domain. If they happen to be outside of the domain, D3 Scales can deal with this issue with
clamping. That said, it’s always better to make sure that your input domain contains all of your data.↩︎
Last modified on 2021-10-07